Doctrine Doctor
Find Doctrine ORM problems while they are still easy to fix.
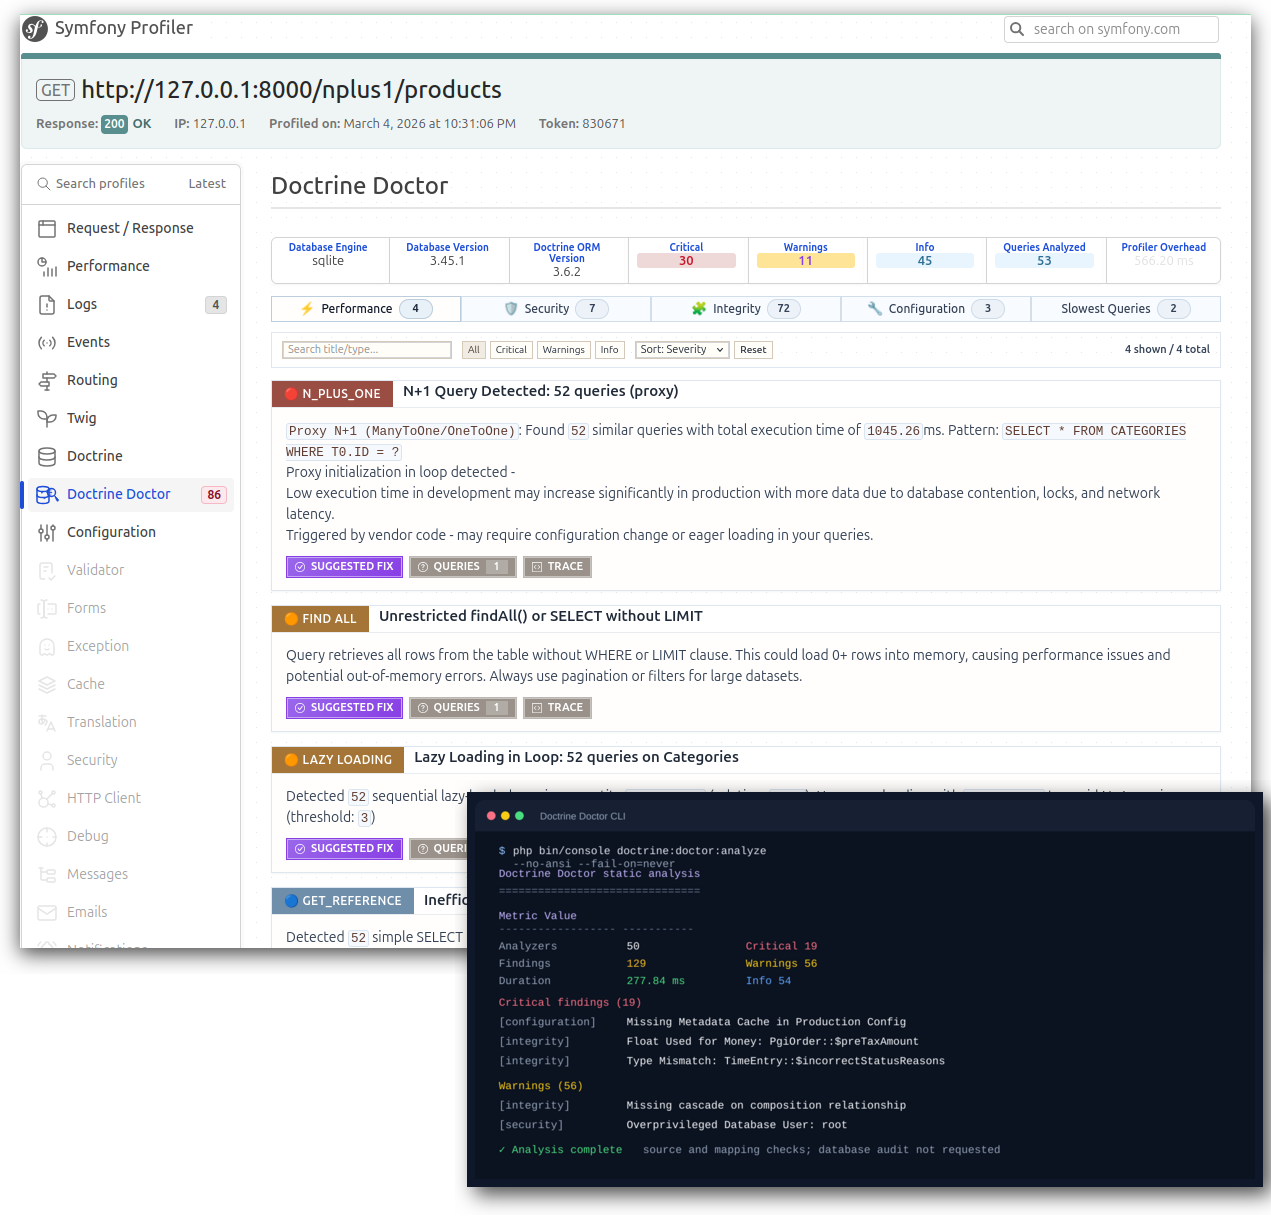
Doctrine Doctor watches real queries in the Symfony Web Profiler and checks source code, mappings, and optional database configuration in CI. Each finding includes context and a practical next step.
Get started now View on GitHub





One tool, two useful moments
Doctrine Doctor complements PHPStan and Psalm with checks focused on persistence:
| When you need an answer | Where Doctrine Doctor helps |
|---|---|
| A page is slow or triggers unexpected SQL | The Web Profiler shows request queries, patterns, timings, and backtraces. |
| A change may introduce a persistence problem | CI checks source code, mappings, and configuration before merge. |
| You want to inspect the configured database | Opt in with --with-database when a live database is available. |
What it checks
| Area | Examples |
|---|---|
| Performance | N+1 queries, slow queries, missing indexes, excessive hydration, unbounded reads, and inefficient joins |
| Security | DQL/SQL injection risks, sensitive data exposure, and insecure randomness |
| Integrity | Cascade and orphan-removal issues, mapping inconsistencies, type mismatches, and invalid entity boundaries |
| Configuration | Charset, collation, timezone, strict mode, cache, and platform configuration |
See Profiler and CI Checks to choose where each check runs. The analyzer catalog contains the complete list.
Quick start
Step 1: Install
composer require --dev ahmed-bhs/doctrine-doctor
Step 2: Load a page in your Symfony app.
The bundle is auto-configured through Symfony Flex. No YAML is required for the first run.
Step 3: Open the profiler panel.
Open the Web Profiler in the dev environment and select the Doctrine Doctor panel.
To add deterministic checks to CI:
php bin/console doctrine:doctor:analyze --fail-on=warning
Add --with-database only in a job that intentionally provides a live database.
Configuration (Optional)
Configure thresholds in config/packages/dev/doctrine_doctor.yaml:
doctrine_doctor:
    analyzers:
        n_plus_one:
            threshold: 5  # default, lower to 3 to be stricter
        slow_query:
            threshold: 100  # milliseconds (default)
Enable backtraces to see WHERE in your code issues originate:
# config/packages/dev/doctrine.yaml
doctrine:
    dbal:
        profiling_collect_backtrace: true
Full configuration reference →
Example: N+1 Query Detection
Problem: Template triggers lazy loading
// Controller
$users = $repository->findAll();

// Template
{% for user in users %}
    {{ user.profile.bio }}
{% endfor %}
Triggers 100 queries
Detection: Doctrine Doctor detects N+1
- 100 queries instead of 1
- Shows exact query count, execution time
- Suggests eager loading
Real-time detection
Solution: Eager load with JOIN
$users = $repository
    ->createQueryBuilder('u')
    ->leftJoin('u.profile', 'p')
    ->addSelect('p')
    ->getQuery()
    ->getResult();
Single query
Documentation
| Document | Description |
|---|---|
| Configuration Reference | Comprehensive guide to all configuration options - customize analyzers, thresholds, and outputs to match your workflow |
| Profiler and CI Checks | Choose where to run Doctrine checks |
| Full Analyzers List | Browse the built-in checks for performance, security, code quality, and configuration |
| Architecture Guide | Deep dive into system design, architecture patterns, and technical internals |
| Template Security | Essential security best practices for PHP templates - prevent XSS attacks and ensure safe template rendering |
Contributing
We welcome contributions! See our Contributing Guide for details.
License
MIT License - see LICENSE for details.
Created by Ahmed EBEN HASSINE

